AI Skills for Better Data Visualization
By Yan Holtz, for people who want to build better graphs.
, sent to your inbox.
Unzip it, then upload a skill folder to Claude, ChatGPT or your coding agent.
01
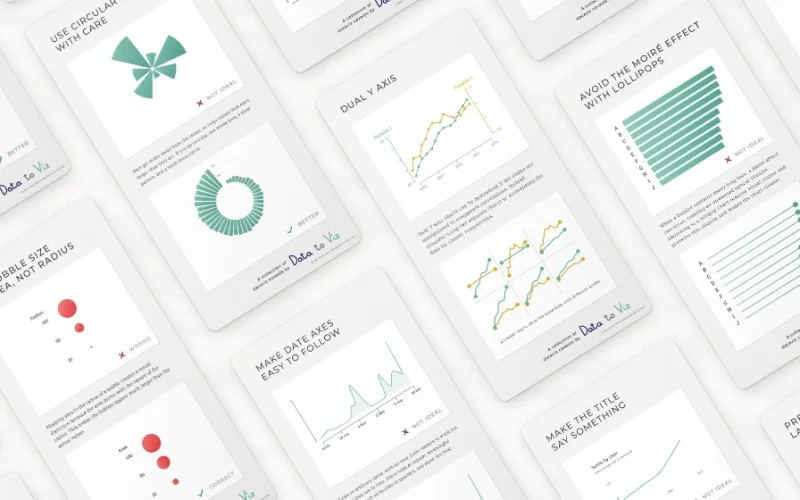
Roast
Review a finished chart and get a list of what to fix.
02
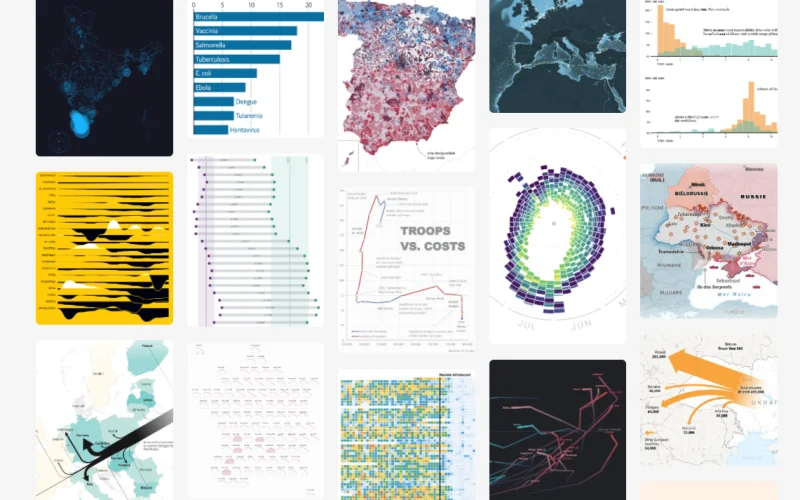
Inspiration
Find published charts to borrow ideas from before drawing.
03
Code
Clean, idiomatic plotting code in your favorite library.
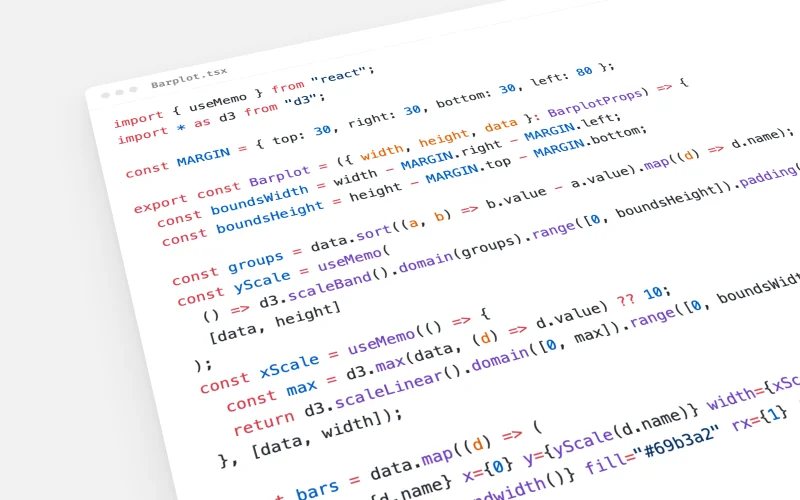
D3.js + React
Build, fix or animate a D3.js chart inside a React or Next.js app.
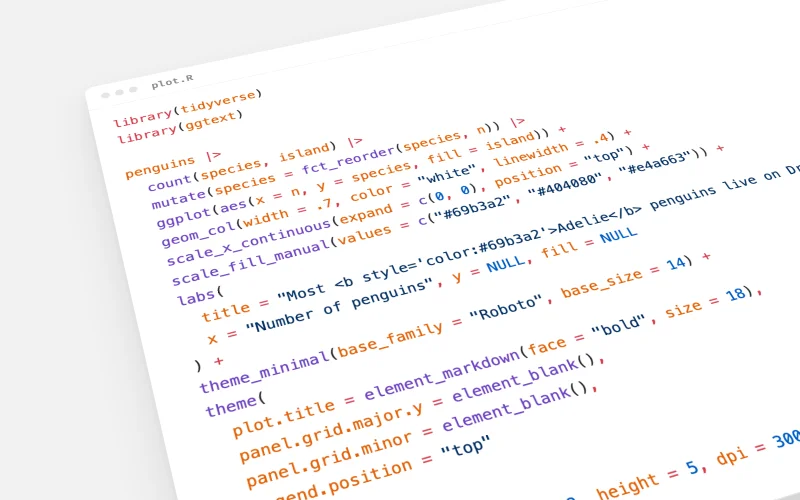
ggplot2
Publication-ready charts in R, following an opinionated set of ggplot2 best practices.
With Cédric Scherer
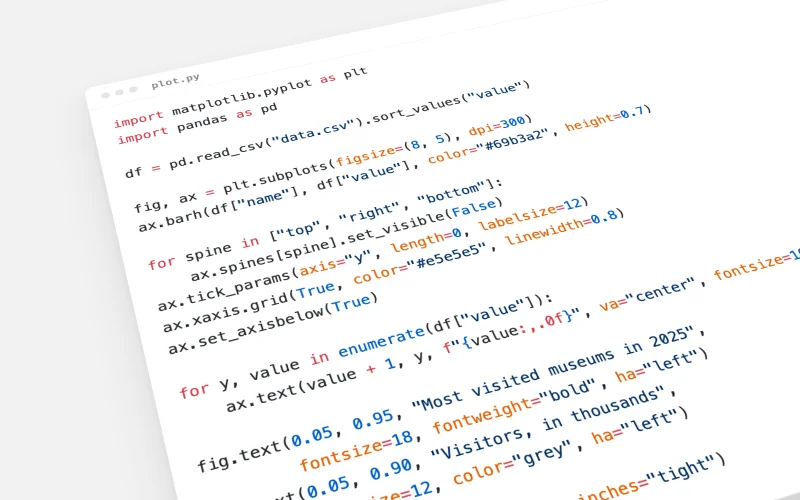
Matplotlib
Publication-ready charts in Python with Matplotlib and Seaborn: styling, annotations, layouts and maps.
With Joseph Barbier
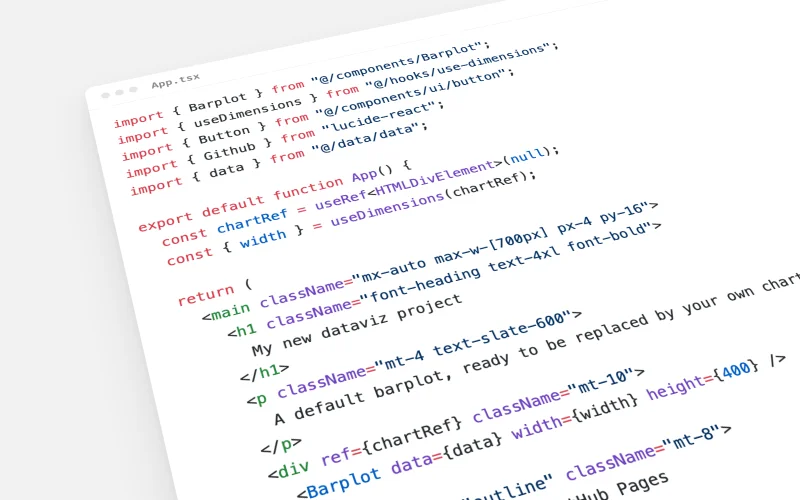
New dataviz project
Start a web dataviz project with React, TypeScript, D3 and Tailwind, ready to deploy on GitHub Pages.
🎟️ Only 6 seats left
Workshop: Claude Code for Dataviz
Skills shine in an AI agent. In a 2-hour live workshop, we install Claude Code together, step by step, and you leave with an agent building your dataviz app.
 Taught by Yan Holtz